Jupiter Visualization
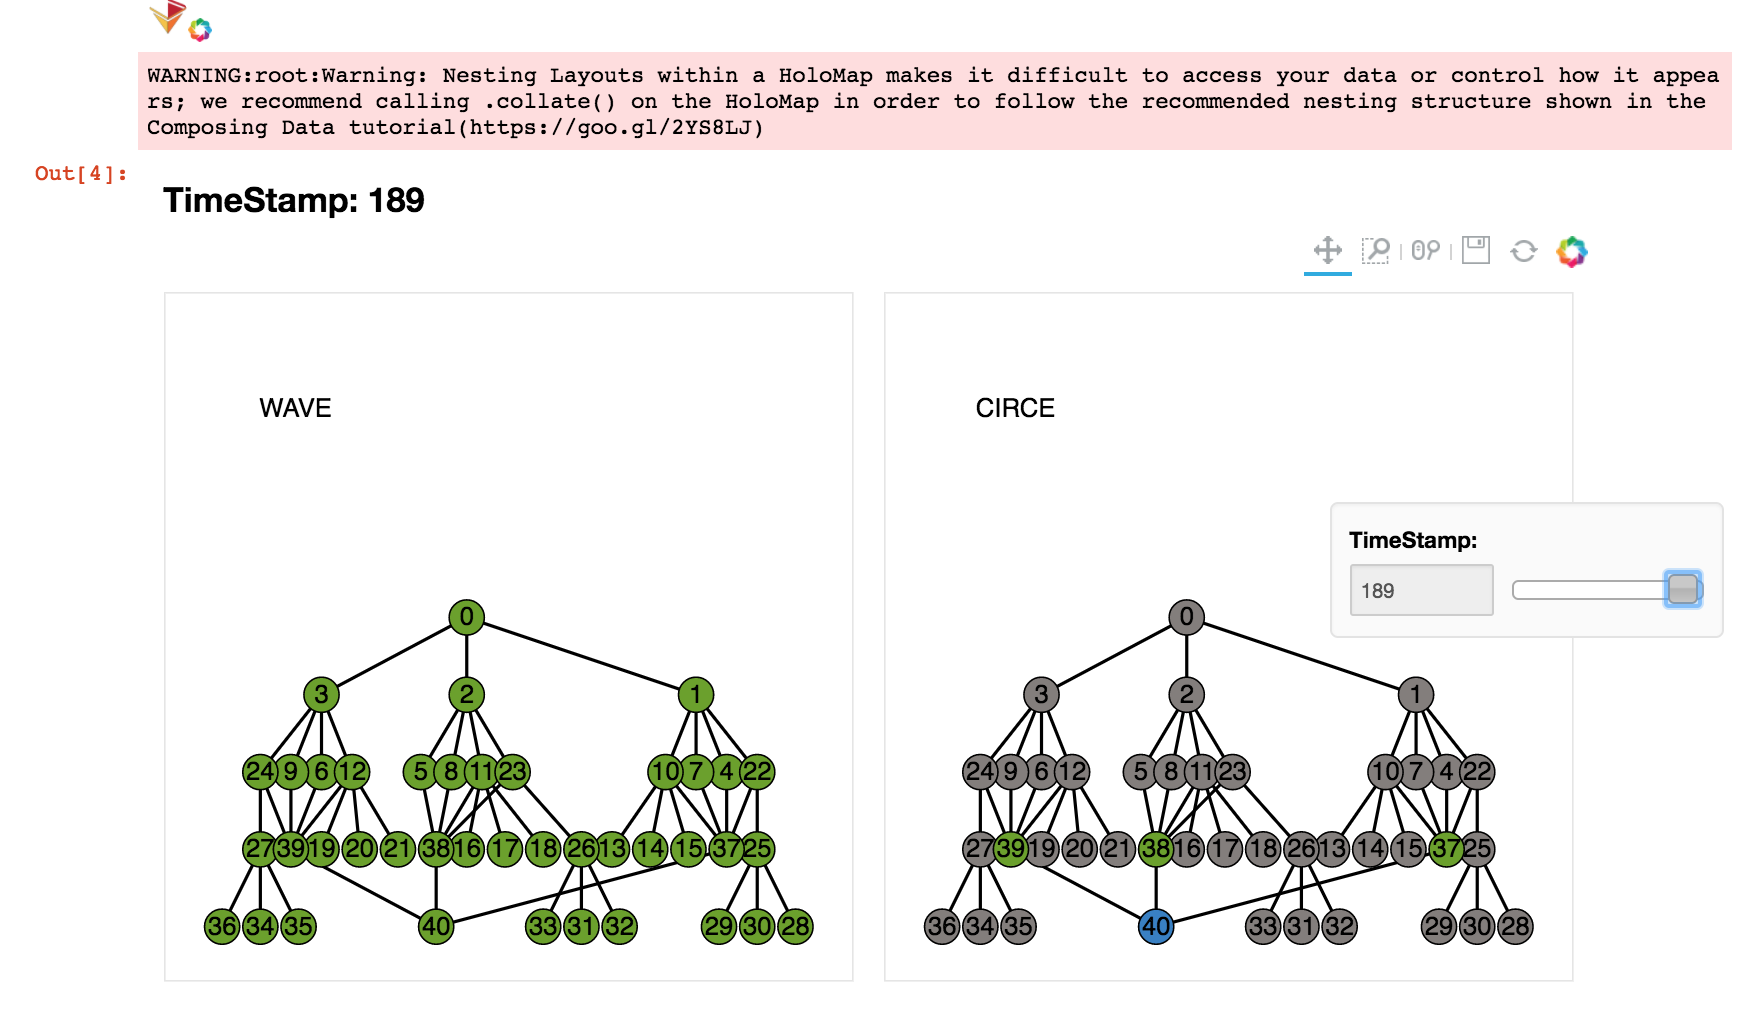
The visualization tool for Jupiter is given here. This tool generates an interactive plot to show the scheduling result of WAVE and the dispatcher mapping of CIRCE.
Warning
To visualize your own application, make sure the format of your logs are in line with the input files of the tools. We will integrate this as a real-time visualization tool for Jupiter in the next release.